This is default featured slide 1 title

Go to Blogger edit html and find these sentences.Now replace these sentences with your own descriptions.

This is default featured slide 2 title

Go to Blogger edit html and find these sentences.Now replace these sentences with your own descriptions.

This is default featured slide 3 title

Go to Blogger edit html and find these sentences.Now replace these sentences with your own descriptions.

This is default featured slide 4 title

Go to Blogger edit html and find these sentences.Now replace these sentences with your own descriptions.

This is default featured slide 5 title

Go to Blogger edit html and find these sentences.Now replace these sentences with your own descriptions.

Showing posts with label Australia. Show all posts
Labels:

Commodities tumbling

Now down more than a quarter since the peak of  June 2010.

Not good news for Australia and increases the likelihood of a further rate cut in the coming few months.

In brighter news, our manufacturing index picked up sharply today.

Graph: RBA Index of Commodity Prices

0 comments
Labels:

Bloomie survey sees unemployment 5.6%; housing finance jump

The latest Bloomberg survey expects unemployment of 5.6% next week, up a tick from 5.5% in May with only a tiny increase in jobs forecast.

Over the past year, jobs growth has been all about New South Wales, which has been reflected in a surging housing market in that state.

Employed persons
Graph: Employed Persons

Unemployment rate
Graph: Unemployment Rate

Source: ABS

The survey also expects housing finance to jump by 2%...so much positivity around the housing markets at the moment.

Meanwhile, what's happening in auctions?

Mebourne recorded a 71% clearance rate today (last week revised to 70%) from 317 reported auctions, a level which should be regarded as 'solid enough'.

In Sydney, auction rates continue to perform very strongly with a scorching 78% clearance rate last weekend.

The hot sector of the market remains the inner west with some 67 auctions today.

Hopes of a correction in Sydney have been dashed.

Dwelling prices in the city are now up by more than 8% since their lowest point of just over one year ago.

As there tends to be a time lag in the data, strong auction clearance rates such as are still being recorded suggest that Sydney's price gains still have some way to run yet. 

After that, investor attention should probably turn to Brisbane.

More experienced heads such as Michael Matusik suggest that housing recoveries tend to "head north" in Australia. 

And Brisbane is overdue for a better run, particularly for those who buy the in-demand property types and in the right locations.

---

Great stuff at Wimbledon yesterday, teeing up a thriller of a final between Britain's Andy Murray and Novak Djokovic on Sunday. Lions vs. Wallabies kicking off in less than one hour's time...

0 comments
Labels:

Made in Australia


List Price: $20.98
Special Offer: check this out!

Related Products

Product Description
This concert was captured live at the Evelyn Hotel in Melbourne, Australia on June 20th 2003. Virgil Donati - Drums, Ric Fierabracci - Bass, Frank Gambale - Guitar.


World Vision Australia - Official site for child sponsorship and ... World Vision is a Christian relief, development and advocacy organisation dedicated to working with children, families and communities to overcome poverty and injustice. Sony Home & Consumer Electronics : Sony Australia Sony Australia website for electronic products: LCD & LED TVs, laptops, tablets, smart phones, DSLR & compact digital cameras, headphones and home entertainment systems. madeit the handmade market open all day every day :: buy & sell ... Shimmer & Sparkle Mad Max (1979) - IMDb A vision of an apocalyptic future set in the wastelands of Australia. Total social decay is just around the corner in this spectacular cheap budget gang orientated ... APS Jobs - gateway to the Australian Public Service Government jobs. Get inspired. Get rewarded. The Australian Public Service is the place to realise your potential. More than 160,000 employees currently enjoy a ... Oxfam Australia A development organisation that promotes social justice and fights poverty by working with communities around the world and through campaigning and advocacy. IP Australia Administers Australia's intellectual property (IP) rights system, specifically patents, trade marks, designs and plant breeder's rights. Attempts to ensure that ... Home australia.gov.au Entry point for all Australian Commonwealth Government authorised information and services. Australian Bureau of Statistics Welcome to the Australian Bureau of Statistics web site. The Australian Bureau of Statistics is Australia's official statistical organisation. We assist and encourage ... Australian Taxation Office Tax information for individuals, Companies and organisations, from the Tax Department of the Australian Federal Government.

0 comments
Labels:

Are low interest rates working?

The job of a central bank, in the words of the famous old quote, is to "take away the punch bowl just when the party gets going". In other words, the bank wants to promote a healthy, growing economy and steer the economy away from recession, but not to allow the economy to overheat.

With the Aussie economy slowing in recent times, interest rates have been cut repeatedly from 4.75% to a record low of 2.75% in a bid to stimulate the economy.

Australian Cash Rate graph

A lower cash rate as set by the RBA should theoretically lead to a faster-growing economy (and eventually, possibly higher levels of inflation) because saving will become less attractive, and borrowing and spending become more appealing. So is the lower cash rate working?

Saving ration since the GFC

It's quite clear that since the global financial crisis, Aussies have been saving more and risk-aversion has been the order of the day. In theory, the household saving ratio might now begin to fall as yields on bank accounts and term deposits are so low that they are now inferior to dividend yields on many stocks.

Household Saving Ratio graph

The effect on share market indices is clear - check out the run-up in financial stock valuations below. Other sectors have also been fired up and investors shun bank accounts and deposits in search of yield. Resources stocks have been weak in contrast, as commodity prices have tanked.

Australian Share Price Indices graph

Consumer spending?

Retail sales are showing promising signs, but we'll need to see a few more months of solid results here before we get more comfortable.

Retail Sales Growth graph

Household debt

Tapering, and that's good, because we don't want household debt to increase further from the current levels.

Household Finances graph

Dwelling prices

Moving up fairly strongly since May 2012, but on a national level, they remain below where they were in 2010. The RBA seems to be very comfortable at this stage, but Sydney and Perth markets seem to be heating up which will have been duly noted.

Dwelling Prices graph

Business credit

Remains very soft at just 0.3% growth in the last reported months. This is very disappointing and much work still to be done here. The RBA may need to cut rates again to just 2.50% to get the domestic economy moving.

Business Finances graph

Dwelling approvals and construction

Residential building is up, but nowhere near enough to plug the gap left by the massive mining construction boom. This is a key reason that we are likely to see another interest rate cut. 

Graph: Value of building work done

There is some light at the end of the tunnel, potentially, as dwelling units approvals have increased very substantially over the past 12 months (more than 27% on a seasonally adjusted basis). Australia needs the approvals to translate into actual construction. Here's dwelling units approved:

Graph: Dwelling units approved

Private sector houses approvals also up, although more steadily:

Graph: Private sector houses

Source: ABS

Unemployment

Number of employed persons is increasing, which has been great to see:

Graph: Employed Persons

Unemployment numbers reported have been all over the place, in fairness, but figures look likely to run higher than the present unemployment rate of 5.5% as the labour-intensive mining construction boom unwinds, and the trend is moderately up since 2012.

Graph: Unemployment Rate

Source: ABS

Summary

Well, it depends on whether you're glass is half empty or half full. 

I see lots of promising signs but much work to be done, with the RBA retaining the ammunition to cut rates further as required. Others note a slowing economy and see risk, risk and more risk. 

Commodity prices have fallen which is a real concern:

RBA Index of Commodity Prices graph

On the plus side of the ledger, the Aussie dollar has tumbled dramatically against the greenback in to the 91 cent range:

Australian Dollar Against US Dollar, Euro and Yen graph

Inflation remains benign and comfortable within the RBA's 2-3% target range, so it looks likely to me that we will see another rate cut in the net few months which should begin to fire up the economy.

I remain an optimist at this juncture.

0 comments
Labels:

RBA cuts cash rate to record low 2.50%

"At its meeting today, the Board decided to lower the cash rate by 25 basis points to 2.5 per cent, effective 7 August 2013.""

As expected by the market then.

This may be the last cut in the cycle as the economy begins to turn the corner: the RBA has removed its easing bias from the press release.

This interest rate cut will also fire the housing market off to record highs in Australia, in particular in Sydney. Prices in Adelaide and Brisbane remain well below previous peaks however.

Read the release here.

0 comments
Labels:

RP Data: Sydney property market in rude health

Weekly report from RP Data.

Auction clearance rates up to boom time levels of 80.3% in Sydney. Melbourne strong at 71.6%. The two major capitals make up the overwhelming majority of auctions in Australia.


Stock on the market has fallen across Australia. Why? More investors buying who don't have existing properties to sell. 

Across the capital cities, clearance rates continue to improve.


Houses in Canberra are selling fast, but I remain unconvinced that Canberra is a superior long-term bet.

The workforce may be reduced and there are great swathes of land which may be released if planning restrictions are ever eased. And indeed the Government announced yesterday that they will release 4,800 residential plots in 2013/14, which is a red flag for dwelling prices staying strong.

Better opportunities elsewhere in my opinion.

The fastest selling property types are Sydney apartments (34 days) and now Sydney houses (35 days).

I'd be surprised if we weren't discussing price gains in Sydney apartments by election time.


Source: RP Data


0 comments
Labels:

Billabong sunk

Takeover talks fail and Billabong looks instead to debt financing after coming out of its trading halt today. The BBG share price lost another 50% of its value during the trade. 

The Billabong share price has now fallen from above $14.00 in 2008 to just 23 cents.

The XJO ground out small gains of 0.25% after the interest rate announcement.


Source: ASX

---

So, Australia's all important GDP growth will be reported tomorrow.

It's an absolute crapshoot trying to predict GDP given that it combines transactions across household consumption, dwelling investment, business investment...and so on...but, hey, we're looking for 0.8% q/q to give us 2.7% y/y growth.

Not great, but not too bad either. 

Let's see tomorrow!

0 comments
Labels:

Sydney still scorching - 78% clearance rate (again)

Lest there was any doubt about the hot Sydney property market continuing into the chilly winter months...

Another near-record 78% clearance rate today to follow last weekend's 78%, which means that price gains might be expected to continue well into the coming months.

A bit of a dilemma perhaps emerging for the RBA, for an interest rate cut is probably needed to stimulate construction, yet this risks sending property markets such as Sydney into overdrive. 

It may be a sacrifice they have to make, but they must also be wary given that Sydney prices are already well above previous record highs.

---

On the subject of Sydney, an amazing 16-41 win for the British Lions. 

I have to admit that no matter how long I live in Australia, and despite being an Aussie citizen, I'll always support the Brits - can't change that!

Ashes cricket starts on Wednesday and it is roasting hot over here near London. Can't wait...

0 comments
Labels:

The iron ore price rebound

Anyone who's worked in the resources sector will know that commodity price forecasts should generally be taken with a pinch of salt, and the cleverly worded day-to-day commentary (guesswork) an even larger pinch of salt. 

But it is interesting to note the tremendous turn-around in fortunes for the volatile iron ore spot price, particularly as prices were supposedly heading lower before a huge rebound which is approaching a 50% appreciation in price.

Today the spot hit US$131.90/tonne, a vast improvement on  the dismal depths seen in the third quarter of 2012 when the spot price fell below US$90/tonne.

Combine this tremendous rebound with an Aussie dollar correction from above 106 US cents to 91.7 cents and this equates to a A$ price of around $144/tonne.

Wow. 

Great news for the Aussie economy: what a lot can change in less than 12 months, eh?. 

Of course, it is something of a risky business being so highly leveraged against one manic-depressive commodity price as well as a similarly volatile currency, but naturally, it's all 'happy days' and sweetness and light when things are working out in your favour. 

Let's hope that things stay this way...

---

While on the subject of volatility in day-to-day prices, it's also interesting to note that RP Data has Sydney dwelling prices up by more than 4% in fewer than 6 weeks.

Hmm. So much for those "falling house prices" and "more properties being sold into a falling market" being reported in May (in the face of 80% auction clearance rates and 85%+ in the inner western suburbs).

Nationally RP Data has prices up by more than 1% in July, but much of that is really only offsetting falls reported in May. 

If inflation prints low net week (say, 0.6% for the quarter or less) then interest rates will likely be cut again in August and there now appears to be a genuine risk that Sydney's property markets will be sent into overdrive.

Sydney's real estate problems are multi-faceted and well documented: a booming population of 60,000 extra persons per annum, construction too slow, planning restrictions, NIMBYism, a disproportionate level of investor activity and appreciating land prices, to name but a few of the issues.

Sydney stands to be a likely beneficiary of the weak response to interest rate cuts elsewhere - in cities such as Adelaide, prices have stalled over the past half decade despite the recommendations to buy property there from yield-seeking property commentators, while Brisbane, Canberra and most regional markets have not been much cop either, and show few signs of really picking up to date. 

It very much looks like a long, slow, bleeding decline for many parts of the country - dropping interest rates fired up activity once through 2009-2010, but it doesn't look as though there will be much response a second time.

Futures markets are already pricing an August interest rate cut to 2.50% as more likely than not (a 64% chance of a cut on August 6), and indeed, they are all but pricing in two further cuts by March 2014.

It's overwhelmingly investors who are pumping up the Sydney property market, with prices breaking to record new heights.

Nationally, however, prices still remain 2% below their previous 2010 peak and don't seem inclined to be heading a whole lot higher at this juncture.

Dwelling prices from the RBA chart pack (a bit of a time-lag in the data here: it will be updated again soon):

Dwelling Prices graph

And copied below is the futures implied yield curve, showing the cash rate as likely to be headed towards 2.25% by March next year. 

Record low levels as the Reserve attempts to rebalance the economy away from mining construction and towards dwelling construction.

Interesting times...


Source: ASX

---

The category 3 heatwave continues in the UK.

Loving the cricket live from Lords, England making 361 in the first dig with another century from Ian Bell.

Now, Australia's turn...

0 comments
Labels:

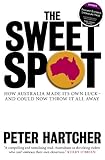
The Sweet Spot: How Australia Made Its Own Luck - And Could Now Throw It All Away


List Price:
Special Offer: check this out!

Related Products

Product Description
Winner of the 2012 Ashurst Business Literature Prize


This book will change the way you think about your country


Australians now officially have the best living conditions in the world. Our country is both fair and free and the only developed nation to have avoided a recession in the past twenty years. So how did it happen and why dont we care?


In The Sweet Spot Peter Hartcher takes readers on a vastly entertaining and thought-provoking tour through Australian politics and history. He shows how a convict colony could have become a banana republic but didnt, how Australia came through the global financial crisis it wasnt just the mining boom and how we could now throw our success away if we dont recognise our strengths and demand true leadership of our politicians.


Hartcher argues that Australias prosperity was not built on dumb luck. In a time when the authoritarian success story of China is strong, Australia offers a better model: a democratic success story. Is it perfect? Of course not. But on some of the most important and apparently intractable problems of the modern world, Australia, believe it or not, is as good as it gets. And the beaches arent bad either.


Airplane Games .org - Fly Your Plane Games Luftrauser Fight against the enemy forces and survive for as long as possible. Green Bomber Complete all of mission objectives and destroy civilian buildings as you ... Technology - New Scientist Find news and information on the latest new technology. Read about new inventions and advances in computer software and information technology Sweet Collective - Lincoln Square - Chicago, IL (773) 293-0888 "I love Sweet Collective! This place makes excellent chocolates and snacks. I came in here earlier this year because I wanted to just buy ... Broadway Radio (BroadwayWorld.com) Broadway's leading streaming web radio station feature show tunes from 1990 to today. SweetSpot Blog - ESPN MLB news, commentary, scores, stats, standings, audio and video highlights from ESPN. Livraison gratuite,Chaussures Requin tn,TN Requins, Chaussures ... Livraison gratuite,Chaussures Requin tn,TN Requins, Chaussures Nike tn Requin,chaussures requin, Peter Bodo Blog - ESPN Right about now, the typical ATP journeyman is taking a deep breath and trying to swallow as he contemplates the fact that the party is over. After a month during ... MM MIDIFILE DEMOS - BandTrax Australia MIDIfiles for MIDIphiles - MM MIDIFILE DEMOS Lost! Re-Set The Complete BandTrax WEB. You Have Been Directed To A Very Old Site Location. Please go to www.bandtrax.com.au And ... Perfect Pie Crust Simply Recipes The big dilemma for those of us who like to cook but dont always have the time to do everything perfectly is whether to attempt to make our own pie crust or to buy ... Endzone News - Football coverage, analysis and opinion : Endzone News Eddie Lacys unexpected slide to Green Bay could have landed him in the perfect position. Heading into the 2013 NFL draft, most analysts seemed to agree that ...

0 comments
Labels:

China growth continues at 7.5%

Fixed asset investment +20%.
Retail sales +13%.
Industrial production +8.9%.

The Government in China has been trying to cool the speculative market sectors including its property market.

GDP growth of 7.5% is a solid result, and correspondingly, good news for Australia as a major resources exporter to China.

0 comments
Labels:

Balibo

Is where I am today. Such very friendly people in Timor-Leste. Went to visit some of the locations in Balibo which you'd be familiar with if you've ever watched the movie, in particular the Portuguese fort from which the invasion was originally filmed by journalists.

s

Also visited the town square house where it's still possible even today more than 35 years later to see the word 'Australia' and the likeness of an Australian flag which was painted on its wall by journalist Greg Shackleton in October 1975.

0 comments
Labels:

Is Australia's mining boom over?

It's a phrase we hear quite a lot at the moment, but is Australia's mining boom over? 

When people say that "the mining boom is over", what they generally mean is that the dollar value of the construction of Australia's mines, which has seen vast capital expenditure undertaken over recent years, is finally passing its peak.

The latest round of figures showed seasonally adjusted total capital expenditure in Australia of a huge $38.51 billion for the period Dec Quarter 2012 to March Quarter 2013. That is a truly massive figure in historic terms for Australia:

Graph: Total asset, total industry

Source: ABS

As you will see from the chart above, $38.5 billion is a staggering sum, and one which we could have only dreamed of just a few years ago. So in that sense, at least, the "mining boom" is not over.

However, as you will see clearly from the chart, total new capital expenditure has begun to fall, by a non-trivial 4.4% in the last quarter, and we might expect the total expenditure to continue falling in the coming months and years, as we can't simply construct mines forever.

Therefore, these cumulative drops will start to represent a drag on GDP growth and the Reserve Bank will likely keep interest rates very low in order to stimulate the other areas of the economy.

What is interesting to note from the most recent capex surveys is that projected total capital expenditure figures may not drop off a cliff as feared. Instead, they forecast that the figures will plateau and drop more gradually:

Financial year actual and expected expenditure - Total Capital Expenditure

Source: ABS

And here you have it in words:

"Estimate 6 for total capital expenditure for 2012-13 is $163,018 million. Estimate 2 for total capital expenditure for 2013-14 is $156,467 million."

A little lower for the 2014 financial year, but perhaps not disastrously so. 

It is a similar story for mining only capital expenditure:

Financial year actual and expected expenditure - Mining Capital Expenditure

Source: ABS

And in words:

"Estimate 6 for Mining for 2012-13 is $98,268 million. Estimate 2 for Mining for 2013-14 is $101,897 million".

A little disappointing, perhaps, given what 'might have been', because as you will see from the non-shaded bars it was once felt that the actual figures would 'peak out' some way higher than they now will.

But again, hardly a disaster for the 2014 financial year if mining capital expenditure holds at above $100,000 million.

Plateau or cliff?

Is this 'plateau' just wishful thinking? Will capital expenditure actually drop off a cliff and begin to punish our economy? In truth, we don't really know yet and only time will tell. 

As someone who used to prepare mining capex surveys and forecasts for the Australian Bureau of Statistics (ABS), one thing I can tell you with certainty is that they are as much an art as they are a science, particularly with regards to which periods projected expenditure will fall into. Just as when forecasting GDP, the number of variables involved are too many to consider with a high level of accuracy.

It is worth noting that the 'actual' figures have sometimes been coming in lower than had been forecast, so we'd be wise to look at the 'expected' figures with a healthy level of scepticism.

From construction to production

The other point to make is that the mining boom to date has mainly been about the construction of mines. 

Eventually, of course, the point of constructing a mining project is that it will subsequently begin churning out massive output which should fuel the next stage of the mining boom: the production phase.

There will be indeed be some wobbles in the interim. As a general rule it takes more people to build mines than it does to operate them, so we may see a spike in unemployment, which is another reason that low interest rates will prevail.

Commodity prices

Disappointingly for Australians, commodity prices have weakened from their peak:

RBA Index of Commodity Prices graph

One piece of good news is that the iron ore spot price has rebounded to above US $125/tonne. 

And, better still, the Aussie dollar has thankfully at long last fallen from 106 US cents to just 90 cents, which means that in Aussie dollar terms the iron ore price is closer to A$140/tonne.

This is a darn sight healthier than the $60/tonne that some were forecasting in October 2012. A volatile commodity combined with a volatile currency...watch this space!

Australia is the world's largest exporter of iron ore and forecasts a 14% increase in exports in the 2013-14 fiscal year. Coal and iron ore exports have already boomed over recent years, increasing from $17.7 billion in 2001 to $110.9 billion in 2011, a sixfold increase.

In accounting terms, Australia will shift from investing in construction capital expenditure to generating revenues.

Summary

Overall, the capex figures in the charts above at this stage seem to imply that the economy will have a fair amount of time in which to rebalance itself as the dollar value of construction should not immediately plummet. But we'll have to keep a close on the data in coming months in order to be more certain about that.

In the meantime, keep watching the labour force employment figures and note whether the low interest rates begin to generate economic growth elsewhere in the economy in the coming months. In particular, the RBA would like to see dwelling construction start picking up to follow a surge in approvals. 

We've done well at building mines; now we need to build some houses.

0 comments
Labels:

Most affordable suburbs have outperformed

Hot sunny day in London where I've been attending auctions. Quite clear that in this part of the world the quality suburbs of London remain smoking hot, but the areas away from London are still struggling to gain momentum even after half a decade, although there are signs at long last of an upturn. Thanks to the UK Government's 'Help-to-Buy' scheme, Bovis Homes today reported a 60% y/y surge in sales as the market is steadily being re-inflated.

Meanwhile back in Australia, RP Data releases figures which show that the most affordable 25% of capital city suburbs have outperformed the remainder of the market over the past decade.


Source: RP Data

It's difficult to avoid make sweeping generalisations here, of course, but this is broadly what we might expect to see at this stage in the cycle, given the below:

Australian Cash Rate graph

The official cash rate in Australia threatened by 2008 to increase back towards the levels seen pre-1993 (it was hiked by 25bps to 7.25% on 5 March 2008) which was the year of the introduction of the target inflation rate. But since that date, the cash has plummeted to record lows. 

In fact the cash rate in Australia has fallen from an eye-watering 17.50% in January 1990 to a record recent low of only 2.75% on 7 May 2013. With households able to source incredibly cheap credit at low mortgage rates (as low as 5% or even less today), this has lead to easily the most material gearing up in the history of Australian households.

Household Finances graph

I'd suggest that anyone who looks at this chart and thinks that homebuyers Australia-wide are preparing themselves for a major and sustained boom in credit growth might be ever-so-slightly optimistic. 

We know that Australia, just as in many other countries, saw banks and lenders dishing out 100% mortgages in the period leading up to 2008, so there is likely to be some bad news in the post in the more affordable segments of the market as and when interest rates revert towards the historical mean.

As noted by RP Data, the premium sector of the market tends to be the most volatile; whilst for the past two cycles, the most affordable properties have been the most stable. The problem here is that their chart only goes back to 1998 and therefore does not go back far enough to show what happens to lower demographic suburbs when interest rates rise: traditionally - and if overseas markets are a useful guide - prices get clobbered as mortgage stress is experienced. 

The good news for property die-hards is that Australia has to date been perhaps unique in developed world economies. We have not experienced a recent major property downturn in the capital cities and we haven't had a recession for some 22 years and counting. And long may that economic record continue. 

However, property is not a magical risk-free asset class and all countries experience property downturns - and when this happens, markets with a strong proportion of investors are likely to be those which hold up best. I wouldn't want to be holding property in the cheapest markets where people tend to live through necessity rather than through choice. 

Instead, I have a strong preference for markets where investors look to at the first sign of a recovery and where foreign funds will flood - close to the centre of the major capital cities.

Some properties in affordable areas will be represent good investments, but be very wary of properties with seemingly attractive high yields and that are in low demand. I've seen properties for sale here in England in small towns for the price of just one pound, and you've probably heard of similar stories from regions of the US. 

Finding new hotspots

In recent months I've had some long, drawn-out  discussions with an experienced property buyers agent who is in the market daily about this very topic. 

Naturally, I understand the theory that instead of buying where everyone else is rushing to buy, you may wish to buy in a regional centre where 'no-one' is buying - in the hope that they might soon do so because of, for example, new government infrastructure, projected employment growth or perhaps a nearby mining project.

The problem with this is that when people migrate to an area to work, they very often do not buy, they rent. And when they do buy (if they remain in the region), they do so to settle based on their earnings which tend to be in line with others in that area.  

The only way in which prices are generally going to be pushed higher and ahead of wages growth is if you can anticipate a swathe of speculation which itself generates a larger influx of accelerating debt - and if you get that in outer areas and regional centres, you'll usually get new home building, which increases supply and masks the actual price increases (showing instead only median price increases). 

Mining towns exhibit many of these traits - price increases can often be fuelled by investors (who may profit if they get their timing right - risky); those who work in the town often save their money and instead invest it in property in the capital cities. 

When will this property cycle end?

RP Data shows that all capital cities have recorded prices gains over the past 12 months, values being  pushed up by the record low interest rates. Gains have been strong in Sydney, Darwin and Perth, but weak in Adelaide and Brisbane.

When will this cycle end, in the unlikely event that it ends coterminously in all cities? Impossible to say and anyone who claims to know is fibbing. 

It could be in just a couple of months' time when Mr. Rudd calls an election. It could be in 2014 as the RBA starts to hike interest rates. It could be later in 2014 as unemployment starts to ratchet up (job losses also hurt affordable market sectors disproportionately, so let's hope this doesn't happen in Australia). Or perhaps the cycle will even run for 18 months or more.

In any case, whenever Australia's next significant downturn occurs, expect the broad middle market in supply-constrained capital city suburbs to hold up best. They usually do.

0 comments
Labels:

Yellow Promo Sports Boomerang - Made in Australia


Features
  • Made in Australia!
  • Small size optimized for kids 6 - 12 years old!
  • For right handed throwers only!
  • With an illustrated 22 page "how to throw boomerangs" booklet!

List Price:
Special Offer: check this out!

Related Products

Product Description
This is a yellow polypropylene boomerang which e use mainly for promotional purposes but it works great and is light enough for kids to use. And low cost. This is a real boomerang at a very low cost!


Sports Courier-Post courierpostonline.com Cherry Hill New Jersey News - courierpostonline.com is the home page of Cherry Hill New Jersey with in depth and updated Cherry Hill local news. Stay informed with ... Democrat and Chronicle Rochester news, community, entertainment ... Rochester New York News - democratandchronicle.com is the home page of Rochester New York with in depth and updated Rochester local news. Stay informed with both ... BOOMERANGS.COM - Boomerang Sales, Outdoor Toys, Flying Toys! Boomerang for Sale, Kids Boomerangs, Flying Toys, Science Toys from Boomerangs.com! 1313 eBay - Electronics, Cars, Fashion, Collectibles, Coupons ... Find great deals on eBay for 1313 and vintage key chain. Shop with confidence. TaylorMade Golf Drivers, Fairways, Irons, Wedges, Putters & Balls Experience TaylorMade Golf drivers, irons, wedges, putters, golf balls & golf accessories. TaylorMade Golf Official Site: 1 driver in golf. vintage pez eBay - Electronics, Cars, Fashion, Collectibles ... Find great deals on eBay for vintage pez and pez no feet. Shop with confidence. Diversify your websiteGeniusWiki portal Home First Previous 1 2 3 4 5 6 7 8 9 10 11 Next Last Cialis We would like to show you a description here but the site wont allow us. Eurosport.com - Sports News Sports Scores Sports Results ... Follow the latest sports news, live-scores and results. Eurosport.com, the european leader in sports Promo voor dames online ZALANDO - Kleding en schoenen online ... SOLDEN tot -50% KORTING op Dameskleding, schoenen en accessoires bij ZALANDO. GRATIS VERZENDING EN RETOUR Gratis klantendienst 0800 490 80.

0 comments
Labels:

Real Estate Talk: What's going on in Australia's property markets?

Catch me on this week's Real Estate Talk show along with Michael Yardney, Louis Christopher and Michael Matusik, where we're discussing what's going on with Australia's property markets as well as how this cycle might be different from those past.

Tune in here.


0 comments
Labels:

Not so super...

A brighter day ahead for stocks in Australia.

It needs to be! Markets are doing their level best to undue all of their good work of the past 12 months.

It was all fairly predictable really. As soon as those articles starting appearing saying "best year for superannuation in years..." the kiss of death was well and truly applied.

Here's the ASX200 one month chart:


Source: ASX

0 comments
Labels:

SMH: Sydney property investment frenzy - all-time record $4bn investor finance approved in May

What I've been suggesting since the very first days of writing this blog - Sydney, as Australia's major capital city, is to be overwhelmed with speculative property investment capital, firing prices in that middle bracket off to all-time highs. 

This has already happened, but check out the investor capital in the pipeline.

There is something of a lag between investor finance data and price gains, so expect Sydney dwelling prices to run higher still over the coming months.

Reports Dr. Andrew Wilson at SMH:

"Latest Australian Bureau of Statistics data has confirmed the flight to bricks and mortar by Australian investors that has continued to gather pace over the year so far.
Driven by the lowest interest rates in decades - for both depositors and borrowers - and a volatile and still underperforming stockmarket, investors are tapping into the housing market in record numbers.
They’re also motivated by the sustained revival in house prices in most capital cities.
Sydney is the epicentre for investor activity, with almost $4 billion in investor finance approved in NSW over May.
This was the highest monthly total ever recorded for residential inventor finance for any state.
The figure also represents 40 per cent of all investor finance loans approved in Australia over May.
Residential investor activity in NSW has risen by a stunning 35 per cent over the first five months of this year compared to the same period a year ago.
Almost 52 per cent of all housing finance in the state is being approved to investors – the highest proportion of any state with the next best Victoria at 44 per cent
Western Australia also recorded its best monthly result for investor loans since the resources boom of 2007, with investor activity now up by an impressive 27 per cent so far this year compared to the first five months last year.
In fact all states are tracking higher for residential investment this year compared to last. Victoria up 11.3 per cent, Queensland is up 4.3 per cent, South Australia is 8.3 per cent higher, Tasmania is up 1.5 per cent, ACT is up 11.1 per and the Northern Territory is a hefty 28.5 per cent higher."

0 comments
Labels:

Keeping the 'Gini' in the bottle

"Money to money"

At my cricket club, we  used to have fundraising raffle draws a couple of times each season.

Many of the prizes were often donated by the chap who was well-known as the "rich guy" in the club. The other members called him, affectionately I think, "Two Jags", which was the nickname of a British MP who drove two prestige Jaguar cars.

I recall a couple of times fate decreed that "Two Jags" won a raffle prize himself, which always drew a good natured heckle or two: "Money goes to money!" or "re-draw!". And, in fact, he usually did simply give the prizes back.

In fact, looking back, the same guy often sponsored the club and its matches and paid for equipment, but rarely did so with any great show. While many of the playing members grumbled about their match fees of membership fees, the club only really survived thanks to the generosity of a few of the wealthier members.

In an ideal world, countries would work in a similar way. The wealthy would pay a fair share of tax. Those in genuine need of benefits and support would be looked after, and so on. Does it happen in reality?

Gini

There are certain numbers in economics which you're never quite sure how are calculated, but can provide a useful measurement guideline. One such number if the "Gini coefficient", which is sometimes known as the "Gini ratio".

Gini is a measue of inequality across a frequency distribution of values, which is one way we can measure inequality in a country: by looking at the statistical distribution of incomes.

In the unlikely event that I come to earn all of the income in Australia leaving income of $nil for the other 23,057,276 of you, then Australia will have a Gini coefficient of 1. We will be perfectly inequal!

More's the pity, this seems to be an unlikely outcome, not least because the government would tax my income and then look to redistribute it elsewhere.

And besides, I'd probably want to spend some of it. There's not much point in having all of the money in Australia if I can't use it!

In theoretical terms, it's actually possible, although highly unlikely, that the Gini ratio could be greater than one, if some of us had negative income.

At the other end of the scale, if all 23 million of us earned exactly the same income we would be perfectly equal, and Australia's Gini coefficient would be zero.

In practice, that's extremely unlikely too. Even in regimes where equality was seen as an ideal, it rarely eventuates in reality.

Gini ratios can be used to measure other forms of inequality too - of education, for example.

Gini ratios of the world

When countries go through periods of great change, Gini ratios can move higher - countries become more unequal - as new wealth is created by a minority. For example, when Britain went through its industrial revolution a new class of capitalists generated great wealth that had previously largely been the preserve of the land-owning nobility.

It's therefore unsurprising that countries such as China and Brazil, which are countries which have rapidly expanding economies, the Gini ratios are high. India looks to be heading in a similar direction.

What is perhaps more concerning, is that Gini ratios is developed world countries such as the US and Britain have also increased in recent decades - societies have become more unequal.

In Australia, our ratio has increased too, although we are somewhere 'in the pack' when it comes to global inequality.

Gini ratios can sometimes be misleading. Why? Because the ratio can rise while the absolute number of people in poverty decreases, and it can be distorted by other factors such as population booms.

It's also often the case that countries with larger populations can show a greater inequality ratio.

Why do the rich get richer?

It's sometimes said that "the rich get richer, and the poor get poorer" and sometimes, it is true.

Why? Largely it comes down to knowledge and the law of reinforcement - wealthy people tend to understand finance and tax laws, and they increase their financial skills through habit. As Aristotle said: "we are what we repeatedly do."

One of the reasons that the wealthy have been able to create wealth for the longer term is that they understand how to use the power compounding growth in their favour.

In theory our tax systems are designed to be progressive, in that the wealthy should pay the lion's share of tax and the wealth of a country should be redistributed fairly.

Unfortunately, it just doesn't work that way. A theme which we will see developing more and more in coming years is that multinational companies will be increasingly chastised for clever profit-shifting across tax jurisdictions.

With the advent of the internet, it's harder than ever before for tax authorities to determine where companies should be domiciled and where taxes should become payable.

In Britain, Barclays Bank paid only 2.4% tax on its 2009 global profits, resulting in a group of angry protesters storming one of its London branches. The bank paid £113m of corporation tax on profits in the UK despite its multi-billion-pound profitability.

And yet, this was legal. Tax avoidance is legal; tax evasion is illegal. It pays to understand the difference.

Wealthy individuals also know how to avoid large tax bills. One way is to acquire quality, income-producing and appreciating assets and then never to sell them.

I recently posted about how Sir James Dyson, a smart bloke who became a billionaire essentially through inventing a purple vacuum cleaner, has bought up £150 million worth of prime British farmland.

Has Sir James suddenly developed a fascination with Lincolnshire sugar beet at the ripe old age of 66? Well, he might have, but somehow I doubt it. What is much more likely is that Dyson knows that UK farmland is not necessarily liable to incur painful inheritance tax so he may be able to pass on his wealth without the Inland Revenue swiping a large share of his billions.

Better still, prime location British farmland continues to appreciate in value, so the Dyson legacy wins twice over.

Sometimes, money does indeed go to money.

0 comments
Labels:

Ashes rain-tained

Still raining at Manchester at 4pm, so barring miracle it looks as though England will retain the Ashes without much of a chance for the Aussie to have a say today after a promising morning. 

A shame that rain had to intervene - Manchester has a long history of draws in Test Matches versus Australia, largely thanks to inclement Lancastrian weather. 

Congrats to Ali for a successful first Ashes series as captain and to the other England players - I can report that all the lads back at Maldon are very proud!

0 comments