This is default featured slide 1 title

Go to Blogger edit html and find these sentences.Now replace these sentences with your own descriptions.

This is default featured slide 2 title

Go to Blogger edit html and find these sentences.Now replace these sentences with your own descriptions.

This is default featured slide 3 title

Go to Blogger edit html and find these sentences.Now replace these sentences with your own descriptions.

This is default featured slide 4 title

Go to Blogger edit html and find these sentences.Now replace these sentences with your own descriptions.

This is default featured slide 5 title

Go to Blogger edit html and find these sentences.Now replace these sentences with your own descriptions.

Showing posts with label abs. Show all posts
Labels:

ABS: Aussie house prices melt...to a new all-time high

The ABS, released the House Price Indexes today with the data showing prices up to new all-time highs in the June quarter, increasing by 2.4%.

In fact, were it not for upwards revisions to previous quarters, the gains would have been above 3%. 

The main drivers of the growth  in the quarter were Sydney, Perth and Darwin. However, prices once again went nowhere in Adelaide and Hobart.

June quarter

Graph: Established house prices, Quarterly % change—June quarter 2013

Source: ABS

Previous quarters were revised upwards leading to strong year-on-year gains.

The quarterly changes chart shows how Australia's market has picked up very strongly over the last year or so (a little longer in truth; there is something of a time lag in the ABS data).

Quarterly changes

Graph: Established house prices, Weighted average of eight capital cities—Quarterly % change

Source: ABS

After these results, Australian house prices are now nationally the highest they have ever been.

Prices are way higher than previous peaks in Sydney (+4.6%), Perth (+4.8%) and Darwin (+12.3%), but this is offset to some extent by cities such as Adelaide and Hobart, where prices remain below where they were in 2010.

Year-on-year the strongest gains have been in Sydney, Darwin and Perth, but weakest in Adelaide where prices have not budged despite generational lows in interest rates.

With a further interest rate cut today, the housing market will likely continue on its upward path. 

In particular, the Sydney market seems to have all the elements in place for a property market boom: properties are selling very quickly and there is little available stock on the market.

It's an awkward result for those advising homebuyers to stay out of the market for the last few years as the market looks set to continue increasing in the short-term.

You can fudge the numbers all you like by adjusting them for inflation or incomes, GDP or whatever, but the simple fact is that real estate is bought using nominal dollar amounts - and if you took the advice to stay out of the market you'll now likely be paying more for a house.

My position has always been that over the longer term, the most rational proxy for house price growth is simply the growth in household incomes.

Of course, the path going forward won't be smooth - there will always be peaks and troughs, and a correction might always happen - but the market has a funny way of making monkeys of those who try to be too clever by second-guessing it or sermonising about 'inevitable' negative outcomes.

Markets are far less predictable than people seem to believe (they've seemingly learned nothing and they still talk in absolutes despite having been wrong over and over again: "this will happen; that will eventuate...).

The result has caused anger among would-be homebuyers who have stayed out of the market for half a decade on the promise of a major correction.

Residents of cities such as Adelaide were merely sold something of a dummy, with prices broadly having gone nowhere, so all that has been lost has been five years or so of rent money. In cities such as Sydney, Melbourne and Perth, though, it was a full-on hospital pass, with prices moving up very strongly and renters being clobbered.

In direct contradiction to the predictions of an inevitable housing bust, I've unerringly forecast that the lagging supply in Sydney's inner ring suburbs will most likely see prices boom to record new highs. Despite all the smoke and mirrors, I've seen nothing to date which alters my view. The Sydney market is tight, supply is lagging and the population is booming by the year.

With interest rates now lower still and the banks cutting mortgage rates in a battle for business, it could yet end up being a complete stitch-up for those who predicted a market crash...a right bang-up job.

0 comments
Labels:

Most read articles on Property Observer

Read my piece here, one of the most read articles on Property Observer this week.


Sadly I got slightly fewer readers than Professor Steve Keen's piece on Australian property's "slow bleed", where he basically now notes that "over the next two decades" Australia might have lower house price to income ratios.

This is  big shift from his initial "40% price crash" predictions of 2008 which came to nothing.

And...two decades?! That takes us to 2033!

Keen might be right, prices might be lower in 'real terms' in 20 years time. 

But most people can pay off a mortgage in much less time than that - and besides, if Keen is predicting that prices will be higher in absolute terms, then I'm not quite sure that's much of a story.

---

Stocks have sunk 0.7% lower this morning following the US down. 

Lending finance for owner occupation continued to increase by 1.2% in April as expected per the ABS.

0 comments
Labels:

Market psychology (Sydney property booming)

Auction boom

The Sydney property market once again recorded an "extraordinary" 81.3% auction clearance rate on Saturday at a median sale price of some $835,000 according to Australian Property Monitors. One auction clearance result at such an elevated level may or may not represent an anomaly, but that's now four consecutive weekends where the rate has exceeded the so-called 'boomtime levels' delineated by the 80% barrier. 

Meanwhile futures markets are pricing in another interest rate cut to just 2.50% as greater than a 9 in 10 likelihood for Tuesday. Indeed, cash rate futures markets imply that we may see rates as low as 2.50% right through until 2015, although that outcome is naturally dependent upon the success or otherwise of stimulatory monetary policy managing to resurrect other key sectors of the economy.

I've predicted on this blog for the last 18 months that the Sydney property market will be the prime beneficiary of the overriding weakness of many of Australia's other property markets. 

Weak property market recoveries

RP Data shows that prices in Adelaide have waned badly in the last quarter are now lower than they were 12 months ago, despite generational lows in interest rates. Prices have also fallen slightly year-on-year in Hobart. Brisbane has fared no better than Adelaide over the past half-decade with median prices below levels seen in 2008, and many regional markets have been in a steady decline for several years now. 

The same data provider reported back in May this year that house prices in real terms (i.e. when adjusted for inflation) were in the region of 10-20% lower than at their peak across every capital city.

Any lingering doubt that strong price growth would follow increased activity in the hot sectors of the Sydney market (inner west, lower north shore, city and east) has been eliminated. This week has seen properties in my neck of the woods (Pyrmont, the inner west, city and east) selling at astonishing prices, with full asking prices often being met and auction results comfortably clearing reserves.

In fact, ask market participants and they will tell you that in favoured suburbs and market sectors price growth over the past 12 months has been comfortably higher than the reported median gains. Sydney's median dwelling price now sits comfortably above its previous all-time peak, but the apartment market actually broke through to record highs way back in May 2012. 

RP Data has reported that it is the broad middle-priced market which is racing ahead, likely due to the exaggerated levels of investor activity.

Why markets cycle

There are a number of common explanations of why markets move in cycles:

-It's been said that monetary policy, particularly the tightening of interest rates, has been effective in the past at stifling undesirable levels price growth;

-Governing bodies have been blamed at times for becoming addicted to the 'feelgood factor' or 'wealth effect' associated with rising dwelling prices; and

-Construction activity can increase rapidly during a house price boom (and be quelled during times of falling prices) leading to a temporary oversupply (or undersupply) thus exaggerating market downturns (and upturns).

The most compelling factor, in my opinion, however, is the human psychology element. Not only does each new generation see an influx of new market participants who have never experienced a housing bust, humans are emotional creatures: we tend to extrapolate the present into the future in an irrational manner. 

Perhaps unconsciously, we tend to believe that when times are good they will always remain so, and when times are hard we fear they will never improve. We find it harder than we should to bet against the crowd ("...what if everyone else is right and I'm wrong?") and, most damningly of all, we cannot abide the idea of others profiting when we do not.

It was frequently observed back in the 1930s by George Orwell and others that while unemployment was frequently a devastating or humiliating prospect for millions, the impact was sometimes lessened where every household in the street was enduring the same experience. It seems to be human nature that our happiness and level of contentment is impacted by the successes or tribulations of our immediate peers.

FOMO rallies

The FOMO rally or the 'fear of missing out' is the human psychology most evident during a market price boom: prices which have been rising solidly can suddenly accelerate as the herd mentality kicks in. Soros noted in his Theory of Reflexivity that expectations of future price growth can lead to a positive feedback loop and further, perhaps even stronger, price gains.

This phenomenon is more typically associated with pure investment asset classes such as in the equities markets, and yet increasingly residential property is being treated by many as an investment asset as well as being seen as a place for shelter, particularly in the face of unnerving share market volatility.

The underlying thought processes are not dissimilar to those involved when I played the UK National Lottery when I left school as a teenager. 

Of the 49 lads and one lass in the factory I worked in, 48 of them were signed into a Lotto syndicate. I never really thought we had much chance of winning (the odds of an individual ticket taking out the jackpot prize were an outlandish 14 million to one). 

Moreover, I simply couldn't abide the thought of turning up on another freezing winter Monday morning, only to discover that 48 chortling ex-machinists had retired to sun themselves and drink cold cans of Red Stripe by the pool in Barbados (thereby leaving me with the tedious task of grinding tools for 10 hours a day).

Classic human psychology: even at the likely risk of losing, I wasn't prepared to risk missing out where there was a chance of others gaining significantly.

It's the fear of missing out which is now driving Sydney's property markets way past previous peaks. Even those who have previously not shown a remote interest in real estate as an asset class reluctantly begin to consider clambering aboard the bandwagon.

Sydney's market

I'll admit I didn't rate the description of the Sydney's property market experiencing a "mini-cycle" through the financial crisis and beyond. After all, prices can only really go in three directions - they can go up, down or track sideways. While mini-cycles may always appear to be taking place, the true nature of a cycle only really becomes clear as it recedes in the rear-view mirror. 

And yet, at the distance of a few years, it does appear that Sydney's market responded rapidly to stimulatory policies with a burst of activity through 2009 and 2010, before quickly levelling off.

Dwelling Prices graph

In fact, it was a compressed version of a textbook market cycle. First there were the predictions of a 40% market crash. Then, commentary subtly shifted towards "prices falling in real terms". And finally, with conflicting market data sporadically suggesting possible strong price growth, it was concluded by bearish commentators that "we should judge on the ABS data". 


History repeats

And here we are again: rinse and repeat. Since 2010, there have been countless Sydney housing bust predictions, but to date, they could hardly have been more wrong. As the market bottomed out with moderate falls through to around May 2012, the predictions once again gradually shifted towards "price falls in real terms", and finally news articles are now surfacing by the week belatedly predicting new record market highs.

RP Data shows that Sydney dwelling prices have increased since their trough by around 10% in nominal terms. Due to the high levels of leverage involved in residential property, this has resulted in an increase in equity on a median priced dwelling of more than $60,000. That's a troubling figure which the average Sydneysider might take half a working lifetime to save in today's consumer-focused world.

On closer examination, RP Data's oft-maligned Daily Home Value Index now shows Sydney's solid median dwelling price gains as having accelerated rapidly of late, increasing by 5.32% in less than 60 days.


Source: RP Data

Traditionally, this is the shortest phase of the market cycle as the crowd joins the party late and quickly pushes prices to previously unthinkable levels - the fear of missing out for many simply becomes too great, despite the associated risk of losing.

It's easy enough to sit out of the market when all the talk is of a "huge, market-wide crash" or "an inevitable housing bust", and even moderate gains don't tend to create too much fuss. When homebuyers begin to talk about their house having "gone up by 10%", this can become mildly worrying.

But what really grates is when the smug, highly-leveraged property speculator with half a dozen investment units to his name starts to crow confidently about how he is seeing accelerating 25-30% gains right across his entire portfolio since 2009, while savings account and term deposits look set to continue delivering woeful yields.

Remember, this property market recovery has largely been an investor-led rather than a homebuyer story, and this is particularly the case in Sydney. Housing finance data shows that around half of housing finance activity in the city is related to investors. 

Wary of high transaction costs, and armed with their trusty 'buy-and-hold' mindset, a proliferation of investors discourages frequent turnover of stock, clogging up the middle-priced and medium-density sector of the market, thereby potentially exacerbating any potential shortage of appropriate dwellings in desirable locations.

Of course, investment risk increases together with prevailing market prices. The entry price is a key input when calculating the absolute returns on any property investment - entry price and investment risk cannot be decoupled. Thus the market is de-risked when prices are lower, but correspondingly becomes riskier as prices increase. 

Throw into the mix lagging construction of appropriate and well-located dwellings together with a city population increasing at ~60,000 persons per annum, and  I expect to see a further interest rate cut send Sydney's property markets into a relatively short-lived but nevertheless rampant speculation phase. 

This phase of the cycle must necessarily be short for price growth surely cannot continue at such a furious pace for too long, but new entrants are now being lured into the market at ever-higher prices.

0 comments
Labels:

Australian personal wealth hits record highs

The last share market trade of the financial year finished fairly flat as Aussies undertook their final chunks of pre-tax return selling.

November, March and May all saw wobbles of various magnitudes during the financial year, yet the market finished the 12 month period up in value by more than 17%.

After a huge drop in share values through the financial crisis, today's trade completes the best financial year for Aussie stocks in six years since the very healthy 20%+ return in 2007.

Despite the material fall in the index during the last quarter, this is outstanding news for Australian superannuation funds and, together with a resurgent housing market, sees Australian household wealth at new record highs.

I doubt it will get reported too much, of course, given our tendency in the modern world to focus on what we don't have rather than being grateful for what we do, but you can read about it here

Household wealth now sits on average at $76,000, so on that measure at least, Australians have never had it so good - we are as well off as any other country on the planet, which is rather an amazing place to be.

And when you consider the levels of unemployment and negative equity that people have endured in Europe and elsewhere, not to mention how countries not an hour from our coast struggle to feed their populations let alone house them, things in Australia are good.

You might feel that if you aren't a stock market investor then you have not benefited from the strong market appreciation, but is that actually true? Most super funds have heavy exposure to stocks and therefore should show very strong returns for the year even net of management fees and transaction costs.

Rising asset prices during bull markets can sometimes lead to something of a virtuous circle (at least, from the perspective of participants), increasing consumer confidence and therefore benefiting economic growth. Not dissimilarly, rising property prices can lead to a 'wealth effect' as consumers feel more inclined to spend as a result of their increased net worth.

It has been said many times that Australian property prices cannot increase too dramatically in this cycle as credit growth should be capped in line with deposit growth (not that there is much evidence of regulatory controls holding back property prices in New Zealand).

This may be true to a point, although Australians have been saving more in recent years. According to the ABS, 22% of Australian assets are now held in cash and deposits which is comfortably ahead of the 10 year average.

Furthermore, as the chart below suggests, Australians are significantly wealthier than they were a year ago (and indeed, they are now wealthier in absolute terms than they were before the financial crisis, taking our average personal wealth to unprecedented levels).

And while much of the increased wealth is locked in super funds, self-managed superannuation funds can now elect to buy investment property too.

As housing finance figures improve it now appears likely that there will be further price gains in this property cycle.


Source: ASX

0 comments
Labels:

RP Data: Property Market Indicators

Fastest selling property types are units in Sydney at only 33 days, followed by houses in Sydney at 35 days. Houses in Canberra and Melbourne are also selling fairly quickly:


Auction clearance rates remain very strong in Sydney, but perhaps will now ease a little as the winter months fully set in:


Mortgage index? Hard to say, but may also be slowing up a little - it will be interesting to follow the ABS figures in coming months for further evidence:


Source: RP Data

0 comments
Labels:

ABS: Household incomes recovering after global financial crisis

Today's release from the ABS revealed some interesting trends on household income growth.

"Income in low and middle income households grew by over four per cent between 2009-10 and 2011-12, according to a report released today by the Australian Bureau of Statistics (ABS).

"Growth in household income stalled after the global financial crisis," said Stephanie Cornes, Director of Household Economic Resource Surveys at the ABS, "but figures from 2011-12 released today show that household incomes are recovering."

"Low income households have seen an increase of five per cent from 2009-10, and middle income households have seen an increase of four per cent. High income households have been fairly stable, with no significant growth."

"Overall, the share of total household income received by low and middle income households has grown since 2007-08, while the share received by high income households has fallen. These results are reflected in more equal incomes across Australian households since 2007-08," Ms Cornes said."

The ABS found that real equivalised disposable income increased by 49% between 1994/5 and 2011/12, despite a break in the trend during the global financial crisis.

S1 CHANGES IN MEAN REAL EQUIVALISED DISPOSABLE HOUSEHOLD INCOME

Graph: S1 CHANGES IN MEAN REAL EQUIVALISED DISPOSABLE HOUSEHOLD INCOME (a)

Source: ABS

Notably, disposable income was very high in some states, but low in South Australia and Tasmania.

0 comments
Labels:

Mortgage sales surge to "unprecedented levels"

If there was any lingering suspicion that property prices are falling, today's release from AFG nails them.

There tends to be a time lag between interest rate cuts and a measurable response from the property markets, but the effects of monetary policy easing are clearly starting to flow through.

Interestingly the boom in sales was seen across WA, VIC, NSW, SA and QLD and there is evidence that first homebuyers (FHB) are returning to the market as hoped.

There was a huge increase in FHB mortgage sales in WA. 

Victoria will instead show a false peak in the next month before the expiry of its FHB grant.

Australia's largest mortgage broker AFG reports a huge boom in mortgage sales from February through to May:

"AFG, Australia's largest mortgage broker, processed over $3.6 billion in mortgages last month - an increase of nearly 13% from an already record-breaking April figure of $3.2 billion.
AFG has 10% of the national mortgage market (Source: AFG and ABS data) and the indicative trends of its figures are typically confirmed by definitive ABS data six weeks later.
Demand for mortgages rose most strongly in WA, where mortgages processed increased by 17.7% over April, followed by Victoria (+14.6%), NSW (+10.9%), SA (+8.6%) and QLD (+7.2%).
Demand rose consistently across all buyer types - first home buyers, investors and borrowers looking to refinance."
AFG's total finance commitments are now up by close to 50% on their 2009 levels. This will likely translate to strong housing finance figures for May from the ABS in due course.


Source: AFG

0 comments
Labels:

APM Sydney property wrap (boom)

An extract below from the weekly property wrap from APM below, as winter auction clearance rates hit record levels.

Back in mid-2012, the commentators who'd forecast a price crash were saying that property owners in Sydney should be panicking because prices were flat and hadn't responded to interest rates (they rarely respond immediately). 

Now they will instead report that owners should panic because prices are going to boom and rise too fast.

I'm not sure I follow the logic, while prices in Sydney in income-adjusted terms remain below where they were a decade ago, yet the population is growing at an astonishing rate (yes, I've heard the argument that population growth doesn't lead to dwelling price growth...one for another day).

Property owners would be wise to consider property as a 20-30 year investment rather than the housing bust predictions which will continue to surface every year. 

Assuming that you chose to buy in Sydney in the first place because the population is booming more quickly than our collective ability to construct appropriate dwellings and infrastructure, then nowt has changed as far as I can tell.

We could do a lot better in this regard, but not while we maintain the ridiculous focus on affordability in inner-ring suburbs instead of how to promote better affordability, transport links and infrastructure in other parts of this vast country.

The inner west of Sydney is no longer recording the highest auction clearance rates which the low north shore and the city and east sectors now hitting sky-high levels which are likely to be reflected in price growth. 

Based on the small sample of properties I've looked up, this is probably in part due to vendor expectations having jumped in the inner west...and perhaps some speculative sellers hoping for unrealistic prices.

Benign CPI forecasts imply that there is another interest rate cut in the pipeline which will do nothing to dampen investor activity.

Dr. Andrew Wilson of APM:

"The Sydney weekend auction market continues to strengthen towards record levels with Saturday clocking another year-high auction clearance rate.
After last weekend's 81 per cent rate, the Sydney market reached new heights on Saturday with an 81.4 per cent of properties sold at auction.
The Sydney property market is tracking at levels not experienced at this time of the year since the house price boom of 2002.
Listing numbers this weekend were similar to last weekend's with 306 properties auctioned compared to just 268 the same weekend last year.
The best regional result in Sydney this weekend was recorded on the lower north shore with a clearance rate of 92 per cent. The city and east and the south each recorded exceptionally strong 88 per cent clearance rates at the weekend with the northern beaches clearing 83 per cent of properties listed at auction.
Investors are an important ingredient of rising buyer activity in Sydney's housing market. Last week the ABS reported an all-time monthly record of $3.9 billion in residential investor loans approved over May for NSW. Investor activity in the state currently accounts for nearly 52 per cent of all loans for house purchases.
Good news on the local economic front also last week with the ABS unemployment rate for Sydney remaining stable at a solid 5.1 per cent over June.
Sydney's housing market continues to move from strength to strength with strong house price growth set to follow the best clearance rates for years."

0 comments
Labels:

Swimming against the tide...

Surfing safari

Back in the 1990s, along with two Aussie cricketing pals I set off on a surfing trip, driving up the east coast from our eastern suburbs base in Sydney to the sunny climes of Queensland. Being excitable youths glad to have finished an arduous season of grade cricket, we drank a lot of beer and embarked upon three weeks of Olympic-standard larking around, which, of course, was exactly what we'd had in mind all along.

Amazingly enough, in between all the hooning and the high-jinx, we did actually find some time to surf. My two buddies, one of whom was (and is) a surf coach, hailed from Bondi and Bronte respectively, so it all came easily enough to them. Having grown up myself in a freezing cold climate and possibly the most centrally-located city in England, surfing was not one of my strongest suits, and I struggled gamely, much to the amusement of my unsympathetic young colleagues.

As we reached the most northerly point of our trip at Noosa, we ventured out to tackle some horrible-looking surf. Predictably enough, I was completely wiped out and flailed desperately in my bid to get back to shore (cue more amusement from my Antipodean friends). I later learned the golden rule that all Aussies are taught from birth: don't panic and try to swim directly to shore against a rip current. Instead, swim parallel to the shore until outside the rip. Then return calmly to the safety of the beach.

The stock market tides

Why does Warren Buffett look to buy shares in quality companies and hold them for as long as possible? Simply, because, over time quality companies can generate larger profits, pay larger dividends and increase their valuations.

Stock markets are often perceived to be risky, but risk is related to the specific investments which you choose and the time horizon which you elect to hold them for. While acknowledging the effect survivorship bias can have upon index data, below is copied a chart of the Dow Jones index (DJIA) from 1900 to July 2013. There were ebbs and flows...and even some famous 50 year storms! But the crashes often followed periods of irrational exuberance and tend to look less dramatic as they fade into the rear-view mirror. 


Source: stockcharts.com

The long-term trend is clear: upwards. It's possible to make money with skilful market timing by shorting the market, but on average, the market spends more time moving upwards than it does falling, and the longer-term investor will immediately benefit from a significant head start through receiving a regular and growing dividend stream. Those who sit out of investing in the stock market for long periods are swimming against the current.

The property vortex

In Australia, it is generally cheaper to rent property than it is to buy, so those who elect to sit out of the market instead of buying are not swimming against a tide of dividends. Although renters may not be paying off a mortgage, at least their monthly cash outflows should be lower than those who have recently purchased an equivalent property (although recent interest rate cuts have delivered a welcome affordability dividend to mortgaged owners on variable rather than fixed rates).

Renters, therefore, are only swimming against the ebb of the market if nominal property prices are increasing, in regions where they are being eased higher by demand from homeowners and investors outstripping supply. Investors too, generally experience cash outflows in the early days of property ownership in Australia, so they only move ahead if prices are increasing.

The tides which can push prices higher in a region include: a booming population and therefore a demand which the supply of dwellings is not meeting, a real and sustained increase in household incomes (in particular, where significant jobs growth is being experienced) and an in-flux of speculative investment capital. Where these factors are not in evidence, renters may gently swim across any real or perceived rip, and drift gently back to shore: there is no tide for them to swim against.

City cycles

Property market cycles do not move in lockstep in Australia; some cities experience rising prices while in others they are falling. Certain experts have been saying for around half a decade now that prices in Adelaide will boom. When I started writing my first book back in 2010, I detailed the reasons why I disagreed (and still do) with this viewpoint. 

Although Adelaide has a gentle drift of population growth, the absolute numbers are relatively small, there is plenty of scope for new development, a number of planned mining projects or extensions have been shelved, and I see no reason why the city cannot house its growing population relatively affordably. Renters don't appear to be caught in a rip, because in real terms prices have been becoming more affordable - they are gently drifting back to within reach of some previously excluded younger buyers.

Sydney to outperform

While some cities will continue to see easing prices, Sydney looks set to outperform. 

Although the latest round of unemployment figures from the ABS showed that the Australian economy added a seemingly impressive 160,400 jobs over the past 12 months, it is notable that 81,900 of those were in NSW and 31,700 were in VIC. Jobs growth was weak in QLD and all but non-existent in SA and TAS. These figures help to explain why Sydney and Melbourne have thriving property markets while Adelaide has failed to deliver the long-promised price growth in spite of the lowest interest rates in a generation.

Sydney is a different kettle of fish entirely from Adelaide. Those waiting on the sidelines for a price crash in the harbour city aren't swimming against a gentle undercurrent of population growth, they are facing a full-blown demographic tsunami. Estimated annual population growth may be a touch volatile but the population growing from around 4.1 million at the time of the 2001 Census to above 4.6 million by the time of the 2011 equivalent headcount, suggests a very strong longer-term average of around 50,000 persons per annum.

A higher population does not automatically equate to higher dwelling prices, but last time I was in my apartment on Pitt Street, I took a long, hard look at the vast semi-circular area of Sydney visible from the balcony, and as far as I could tell there were only 3 ongoing residential developments of any stature. 

In truth, there are a few projects coming online such as the expensive-looking new apartments on previously unfashionable Broadway, and indeed a new suburb is being constructed at Barangaroo (not that the $2 million+ price tag for the 100 two bedroom apartments is going to solve any affordability issues). The problem is that few seem to want to venture out to the fringe suburbs, creating high land prices and affordability pressures in suburbs close to the city.

A material fall in prices might or might not be triggered at any given point in time, but with each passing year in the decade since a crash was being called after the turn of the century, the competition for prime-location real estate has been increasing, as wave after wave of immigration hits the city.

The other tide that renters are swimming against is the raging torrent of speculative capital which is flowing into Sydney. Prices do not seem to have faded in Melbourne as had been widely predicted in part because investors have returned to the market in droves, lured in by lower interest rates. Plenty of commentators have also been forecasting price falls in Sydney for years, but these predictions were drowned by the appetite of investors for Sydney real estate. 

According to the ABS, loans for investment purposes with investor lending in NSW increased by nearly 24% on a year ago and NSW made up some 40% of the value of all investor loans approved in Australia in the month of May. Investors  presently account for more than 50% of total home loan activity in the state. With record levels of investor capital washing over the established housing stock and auction clearance rates consistently topping a boomtime 80%, dwelling prices have reached a new high tide level, and increases look likely to continue to be reported over coming months.

1 comments
Labels:

The Great Recessionista Bubble

Dedicated followers of...

Trends come and go in the world of finance, and what is definitely not trendy at the moment is say anything remotely positive about the Australian economy.

And this trend has come for a plausible reason: we're about to head through a sticky patch, being the rotation away from the mining construction boom.

You tend to get mocked by those preaching doom and gloom for saying such things these days, of course, but I'm of the opinion that, slowly but surely, monetary policy will likely work, and we will probably avert an Australian recession.

That's not just my view - the RBA's latest Output Growth and Inflation forecast for the year ending June 2015 encompasses a range from 2.5% to 4% GDP growth.

There was a good deal of excitement two weeks ago when our National Accounts showed GDP growth of only 0.6% for the quarter and 2.6% for the past 12 months. Woo-hoo! Recession here we come!

Well, maybe. 0.6% is by no means a great result, but before we get too excited, I wouldn't be at all surprised if the ABS subsequently announces revisions, as is their wont.

The March Private Capital Expenditure survey released by the ABS on May 30 also showed that the phenomenal growth in mining capital investment is now turning from 'boom' to 'swoon'. Hardly a surprise, naturally, for trees don't grow to the sky and we can't simply build mines forever. We gotta actually start using them sometime.

Graph: Mining

Source: ABS

Perhaps curiously, given all the doom and gloom reported, however, the 'Estimate 2' for 2013-4 total capex actually came in well towards the high end of expectations at $156,467 million. Maybe that is in part due to cost blowouts and overruns according to the anecdotal evidence I hear from buddies and former colleagues still in the mining industry.

We should apply more emphasis to actuals than estimates, of course, but this still implies to me that monetary policy has ample time to do its thing before mining capex really drops off. And mining capex, despite what you may have been led to believe, does not make up most of the Aussie economy - it comprises somewhere close to 6% of GDP.

So, it may not be trendy to say so, but the Reserve Bank has cut interest rates significantly which should stimulate the economy, it still has 275 bullets left in its handgun holster yet, and I think Australia will do just fine.

The Australian dollar has fallen from the stratosphere which will help us along, household consumption was growing through the March quarter, house dwelling approvals and housing finance are rising nicely, and trade exports are on the up too (note: yes, there is a commodity price risk here - granted).

So, sure, we're in for a sticky patch, but a recession over the next couple of years? Unlikely, for my money.

The same crew that has been warning of recessions since approximately the dawn of time, have also been anticipating an Australian property crash for the past decade, throughout which dwelling prices have by and large tracked somewhere close to household income growth.

There is an inherent market risk in real estate, of course, particularly in secondary locations, but I think what the housing bears underestimated was just how far 'them that are in charge' will go to protect its beloved middle markets.

It's also now fashionable to laugh in a derisory manner at those who point towards population growth as having supported property values as the musings of a daft simpletion. So be it.

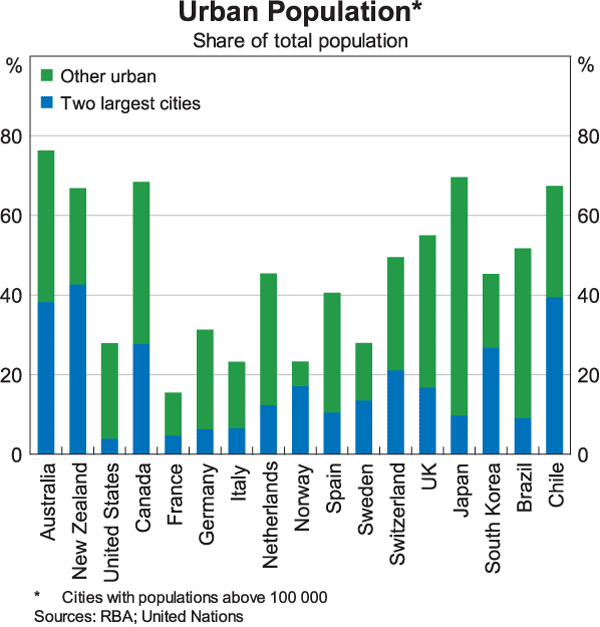
Australia is such an unnaturally urbanised country that it's not at all surprising to me that property values have been eased higher. The 2001 Census recorded 18,972,350 person in Australia. Check out here what the population is today, which will be somewhere well above 23,050,000 when you check it out (the Australian population will have increased every 83 seconds since I typed this).


Sure, property prices would not be impacted unduly by millions upon millions more people competing for our urban land if we constructed enough of the right types of dwellings...in desirable locations...with appropriate transport links and infrastructure, of course...if we didn't suffer from draconian land use restrictions and if we weren't living through an epidemic of NIMBY-ism...and so on.


The key conjunctions there, in the unlikely event you didn't notice them, are the 'ifs'. 

Recessionistas

Now while we are on the subject of fashion, a little while back I used the word "recessionista" or "recessionistas" a couple of times.

Rather unfortunately, the phrase is now being used all over the flippin' place, but, sadly, in a misguided context, it being used to refer to anyone who makes a remotely downbeat point about the Australian economy i.e. they may potentially be inferring a recession risk.

Sad to report, but a recessionista is not a pundit who thinks that there will be a recession and nor is it an economist who is forecasting one.

A recessionista is someone - well, it's a woman, obviously - who continues to dress stylishly through times of economic hardship. Recessionistas are ladies who make the best of a bad situation and try to maintain their fashion-conscious lifestyles by buying in the sales or frequenting discount stores.

It's pretty obvious if you think about it, as the word was derived from two others (recession and fashionista) some time after the economic downturn of the early 1990s.

Just to re-cap, a recessionista is not an economist or a pundit who anticipates or forecasts a recession.

It's a woman who continues to present herself stylishly despite having a restricted budget.

Which is, like, erm...yeah...something completely different. 

0 comments
Labels:

What to expect from the week ahead...

Interesting week of data ahead.

On Tuesday we get the Housing Finance data for April from the ABS.

Obviously there is something of a time lag in this data set, but I'm expecting to see a continuation of the moderate growth in the value of dwelling commitments (currently y/y +4.;5%). 

What would be really nice to see, though, would be an upturn in finance for construction of dwellings (currently y/y +4.6%).

Then on Wednesday we get the Lending Finance data for April. In particular, keep an eye out for housing finance for owner occupation - growth has been weak to date (+1.1% y/y), so some signs of life would be welcomed.

And then on Thursday, of course, we get the Labour Force data.

Most sensible people have given up trying to forecast the employment figures, given that the small sample sizes, poor response rate and sample rotation lead to such erratic results.

The employment figures have been showing an emphatic 'sawtooth' formation - up strongly one month and then down again the next.

Last month the economy reportedly 'added' 50,100 jobs in April. The market expects therefore May to show  a 'drop' of around 10,000 jobs, but if past history is anything to go by, the drop could in fact be well over half of the jobs added in April. Go figure.

As for the headline rate of unemployment, it 'fell' last month to 5.5%, but the longer term trend is a gentle rise, so it would be no surprise to see that increase again either.

0 comments
Labels:

Housing finance keeps ticking up

From the ABS today:

Nothing too dramatic today but housing finance continued to tick upwards through April confirming the ongoing housing market recovery.


Total dwelling commitments +1.2% in April and a clear trend for the year:

Graph: Value of dwelling commitments, Total dwellings

And the number of dwelling commitments are moving almost in lockstep:

Graph: No. of dwelling commitments, Owner occupied housing

Purchase of new dwellings and construction moving up which is heartening to see (Western Australia is leading the way here). After all, it's construction we want to see picking up to boost the economy and construction needs people to buy new dwellings.

Commitments up 17.9% since last year - not too shabby at all. 

Graph: Purchase of new dwellings

As for the so-called "striking" first homebuyers, I've been suggesting for a while now that these numbers will pick up - and FHB commitments picked up by 5% in April.

Don't forget though that in some states the FHB grants shift towards favouring newly-constructed dwellings (Victoria, also Tassie and the ACT) so this will distort the markets in these states.

Investor finance was up again, and is now up 18% year-on-year. Here's investment housing heading back towards the boomtime levels:

Graph: INVESTMENT HOUSING - TOTAL

There's an awful lot of ordinary commentary available if you want to track it down. The trends above are clear enough, but it is true that some of Australia's property markets remain weak.

Such is the nature of property market recoveries.

The obvious observation to make is that the recovery is very much multi-speed and some markets are doing an awful lot better than others.

Overall though, we've seen finance in a clear uptrend over recent months so monetary policy is doing its thing. 

Source: ABS

---

Moderate bounce for stocks today +0.4%.

And the Aussie dollar crumbles to a 32 month low of 93.38 cents, as I suspected it might.

AUD forecasts are being lowered all the over the place, in some cases to 85 cents, which would be healthy for the Australian economy.

Keep an eye out for that Labour Force data, for if it is weak (and I suspect that the yo-yo figures we are getting from the ABS mean that this is possible - if not likely) we could be in for an Aussie dollar death spiral.

If you're worried about your overseas holiday getting more expensive, you can hedge you know...

---

That's all from me today as I am yachting across to Atauro Island from East Timor's capital city of Dili. Tough gig, but there you go..

0 comments
Labels:

AFG: mortgage sales +17% y/y

Australia's largest mortgage broker reports mortgage sales as being up 17% on a year ago.

However, some states are faring much better than others:

"Mortgage figures for June published today by AFG, Australia's largest mortgage broker, show that while some states surged ahead during the last financial year, others are struggling. 

Overall, national mortgage sales were up 17% in June 2013 compared to the same month last year. Leading the pack was WA, up 30% followed by VIC (25.8%) and NSW (19.9%). 

But QLD sales for June were 2.7% lower than in June 2012, and SA figures were 10.3% lower."

This is being reflected in strong property price growth in Sydney and Perth.

Note: AFG was only established in 1994, and it started to get recognition from around 2006 - thus, there is not much comparable data with which to compare "record sales". Some of the growth will relate to market share rather than sector growth. For this reason, more emphasis should always be placed on ABS figures rather than figures reported by AFG.

0 comments
Labels:

Record number of new cars sold in June

A record number of new cars sold last month reports the ABS today.

Seasonally adjusted sales y/y have jumped very strongly in NSW (+7.0%), Victoria (+9.5%) and Queensland (+7.2%).

Consumer sales may not be hot, but they're hardly dead in the water either.


Source: ABS

0 comments
Labels:

RBA shows moderately increasing housing credit

From the Reserve Bank today:

"Housing credit increased by 0.4 per cent over May following an increase of 0.4 per cent over April. Over the year to May, housing credit rose by 4.5 per cent."


A lot of panicked articles doing the rounds today as the RP Data index shows colossal gains in June, particularly for Sydney where prices have apparently increased by 3% in the past month alone.

I wouldn't get too excited. Just like last month when prices were apparently falling.

It all just goes to show the silliness of relying one daily movements in one data source, with all the data collection issues it faces.

Over 12 months prices are up ~5.5% in Sydney and ~7% in Perth, and are only up marginally in other capital cities. 

But I haven't seen any indicators of prices surging at the levels being reported this month.

Keep an eye on the ABS credit growth figures over coming months.

0 comments
Labels:

Unemployment to tick up today?

Labour Force data out at 11.30am.

Expecting to see unemployment tick up today from last month's surprise 5.5%, perhaps even to 5.7%.

The April figures showed 50,100 jobs added (+0.4%) but if ABS past history is anything to go by we'll see a chunk of those figures wound back in May.

Such is the way of ABS employment figures...

0 comments